- تعلیم
- Strategi Trading
- Indikator Aroon: Melacak Siklus Hidup Tren
Indikator Aroon: Melacak Siklus Hidup Tren
Setiap pergerakan pasar memiliki ritme — awal, penguatan, dan akhirnya perlambatan. Indikator Aroon membantu trader memahami di mana posisi tren dalam siklus tersebut. Dengan mengukur seberapa baru harga mencetak titik tertinggi atau terendah, Aroon menunjukkan kapan tren sedang menguat atau melemah — sering kali sebelum terlihat jelas pada grafik.
- Apa yang diukur oleh indikator Aroon
- Cara membaca data
- Cara trader menggunakan indikator Aroon
- Kekuatan dan keterbatasan indikator Aroon
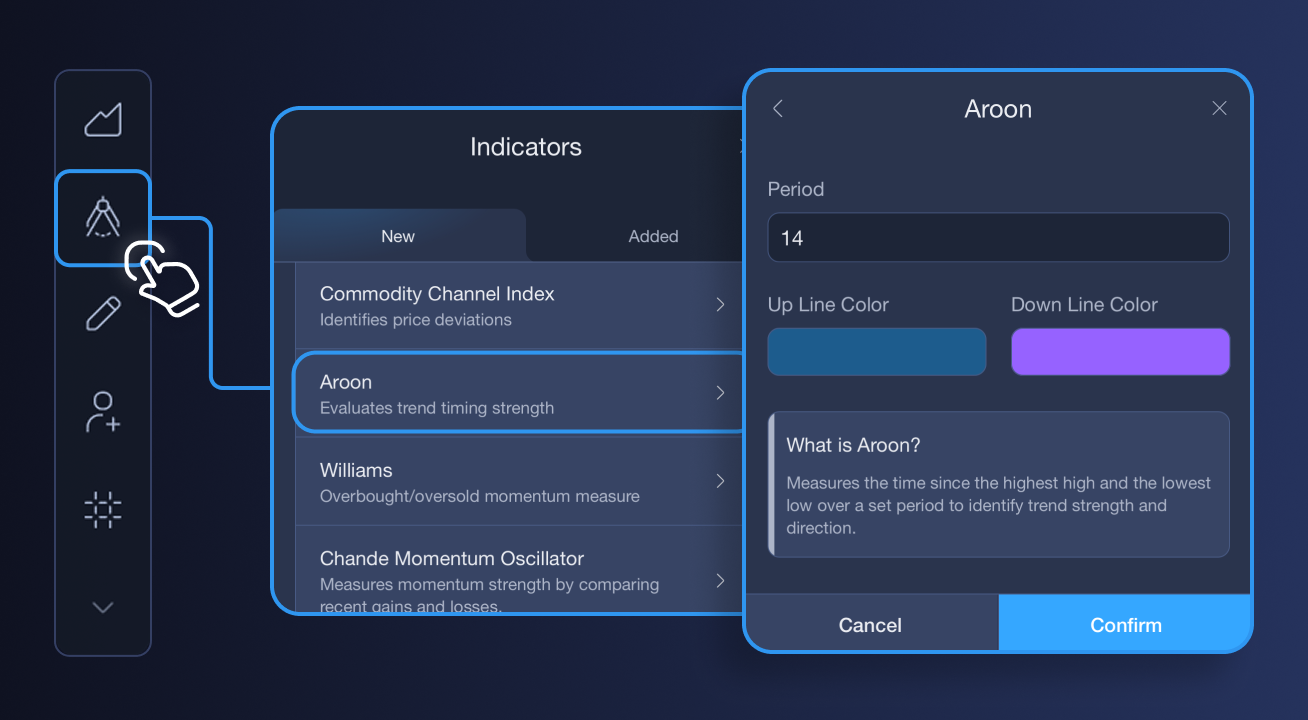
Apa yang diukur oleh indikator Aroon
Aroon terdiri dari dua garis yang bergerak antara 0 hingga 100:
- Aroon Up: Mengukur berapa lama sejak harga terakhir mencapai titik tertinggi.
- Aroon Down: Mengukur berapa lama sejak harga terakhir mencapai titik terendah.
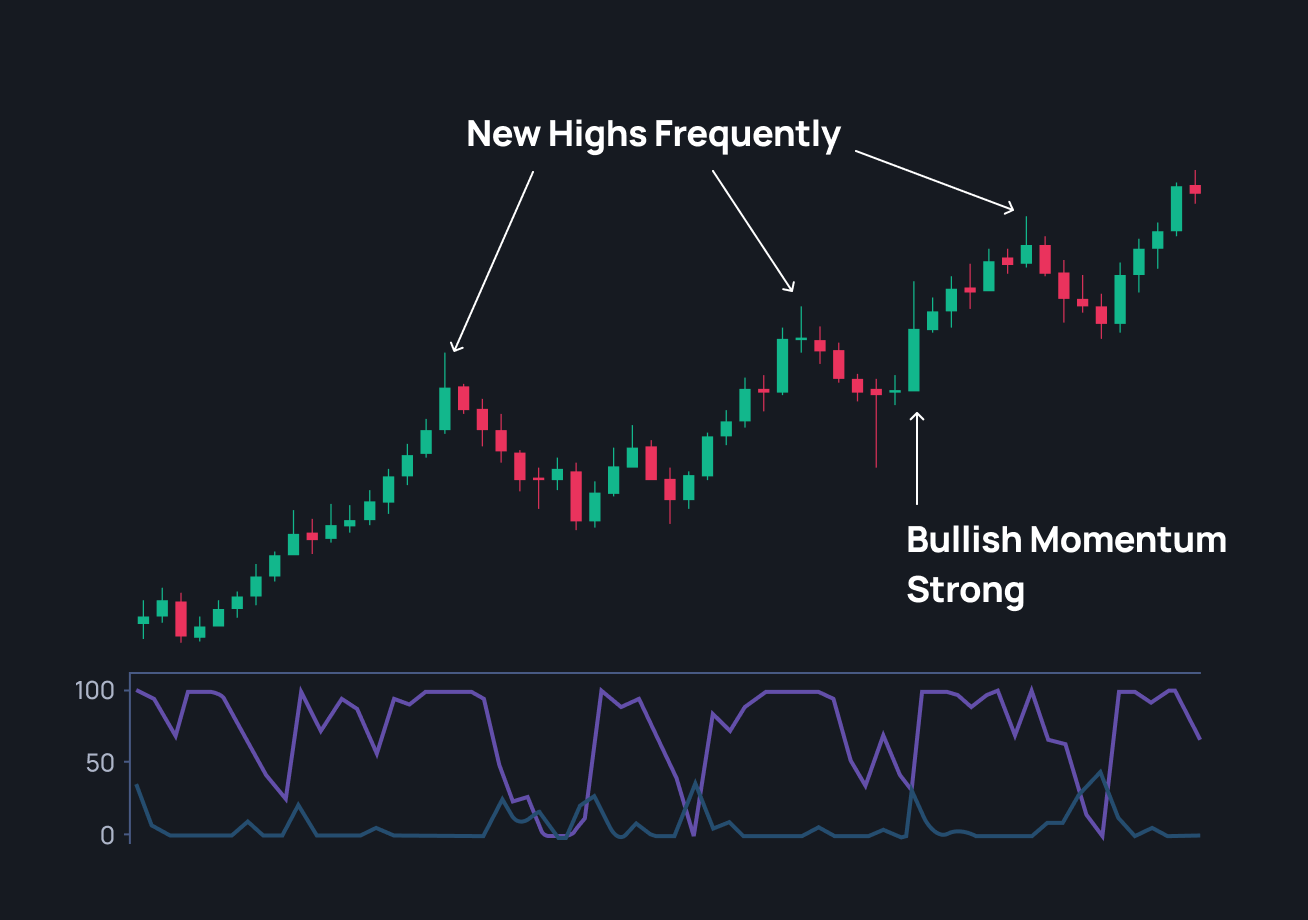
Ketika garis Aroon Up berada mendekati 100, pasar sering mencetak higher high — tanda momentum bullish yang kuat. Ketika Aroon Down berada dekat 100, kondisi sebaliknya terjadi — bearish sedang dominan.
Hubungan antara kedua garis ini menunjukkan apakah pasar sedang trending, melemah, atau bergerak sideways.
Cara membaca data
Memahami interaksi antara Aroon Up dan Aroon Down adalah kunci:
- Uptrend kuat: Aroon Up mendekati 100, Aroon Down mendekati 0.
- Downtrend kuat: Aroon Down mendekati 100, Aroon Up mendekati 0.
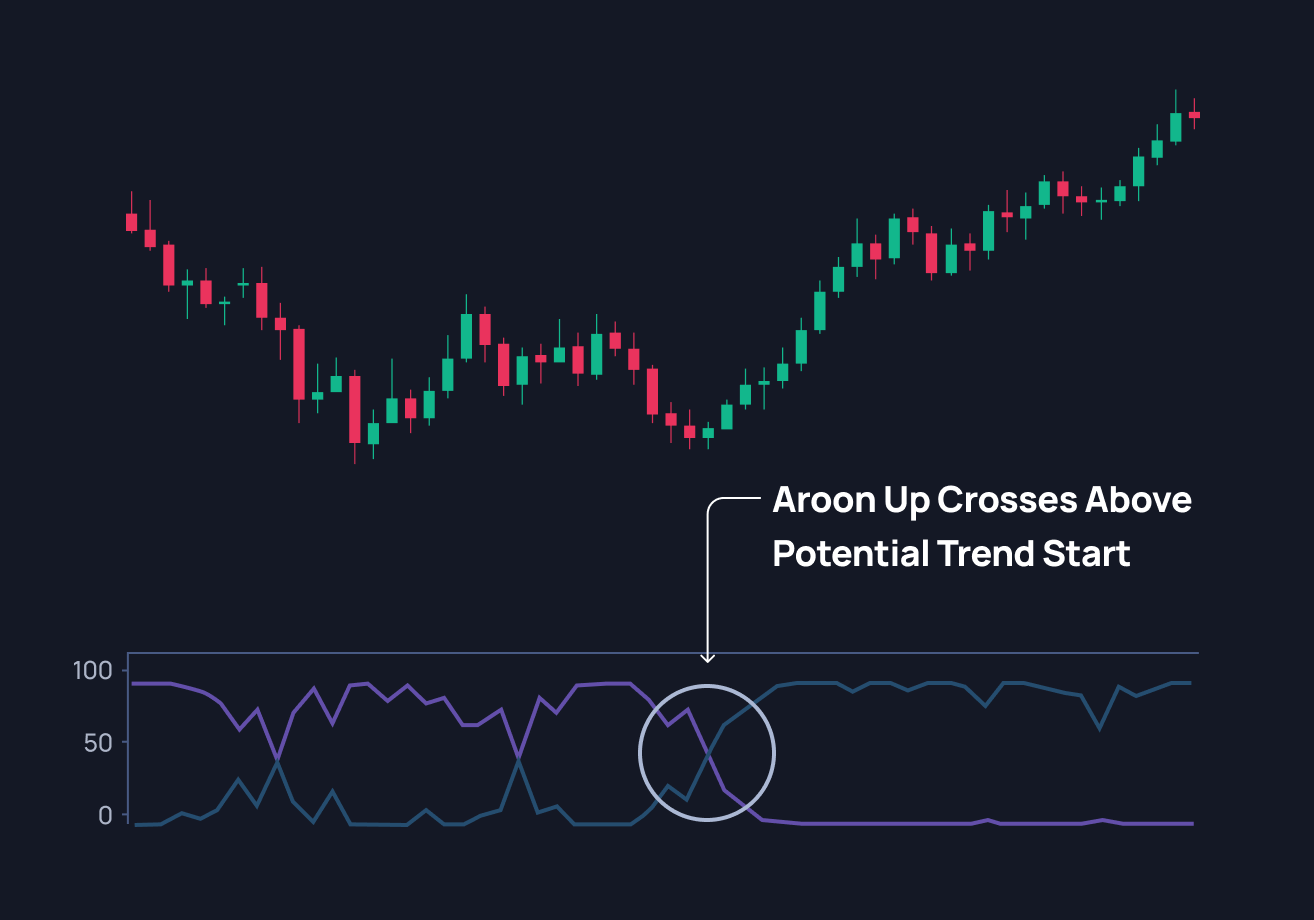
- Crossover: Ketika Aroon Up melintasi Aroon Down ke atas, ini sering menandakan fase bullish baru. Sebaliknya, crossover ke bawah menandakan potensi bearish.
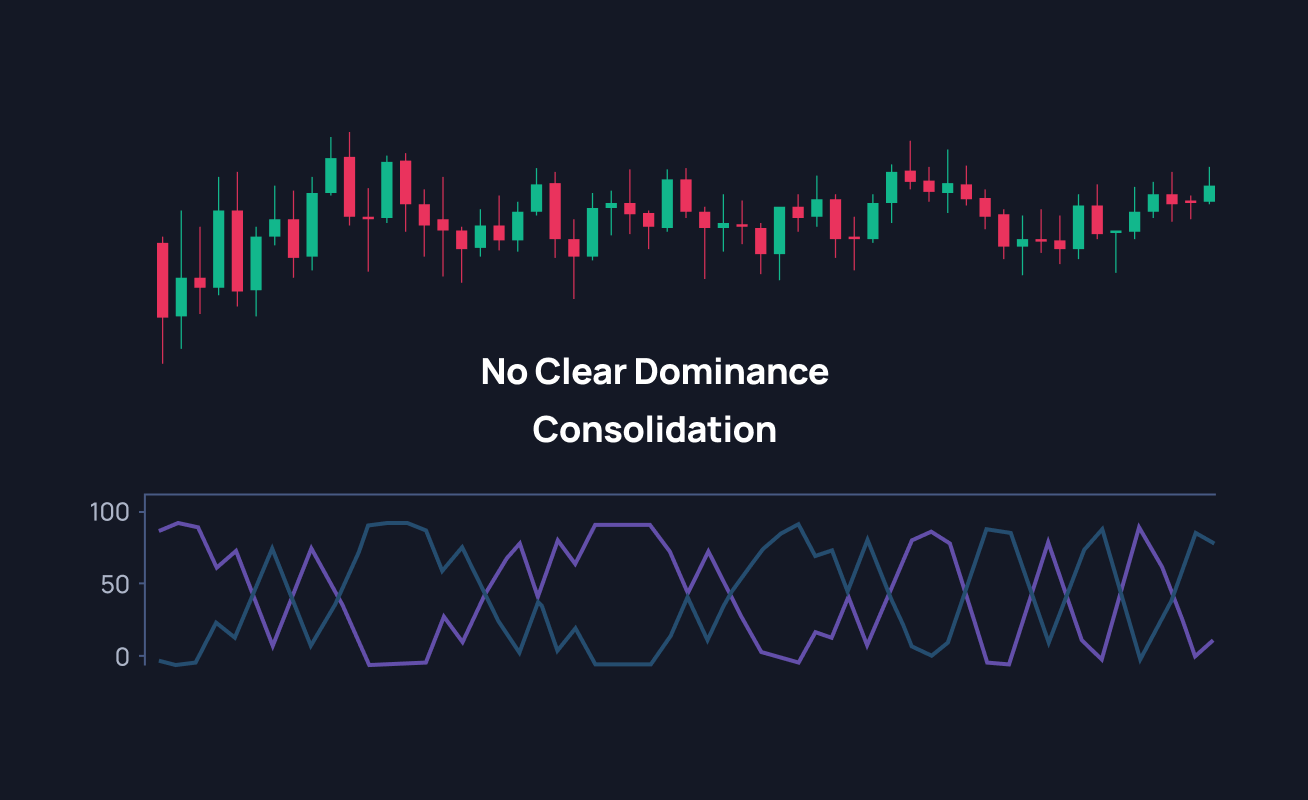
- Kedua garis di sekitar 50: Menunjukkan pasar sedang sideways atau tidak memiliki arah jelas.
Berbeda dengan banyak indikator lain yang bereaksi terhadap harga, Aroon berfokus pada waktu — seberapa baru pasar mencapai titik tertinggi atau terendah — sehingga memberikan cara unik untuk membaca kekuatan tren.
Cara trader menggunakan indikator Aroon
1. Mendeteksi tren baru
Ketika Aroon Up melintasi Aroon Down dan tetap tinggi, ini menunjukkan bahwa buyer secara konsisten mendorong harga naik. Trader sering menggunakan kondisi ini untuk mengidentifikasi awal tren bullish.
2. Mengenali kelelahan tren
Jika kedua garis mulai bergerak ke tengah (sekitar 50), ini bisa menandakan bahwa momentum melemah dan pasar mungkin mulai konsolidasi.
3. Mengonfirmasi pembalikan arah
Setelah uptrend panjang, jika Aroon Down melintasi Aroon Up dan tetap tinggi, ini menjadi sinyal awal bahwa pasar mungkin berbalik arah.
Kekuatan dan keterbatasan indikator Aroon
Salah satu alasan trader menyukai indikator Aroon adalah kejelasannya. Indikator ini memberikan gambaran visual sederhana tentang kekuatan atau kelemahan tren tanpa interpretasi yang rumit. Jika digunakan dengan benar, Aroon membantu trader tetap sejalan dengan arah utama pasar dan menghindari entry saat momentum melemah.
- Memberikan wawasan awal tentang perubahan kekuatan tren.
- Memberikan gambaran visual yang jelas apakah momentum menguat atau melemah.
- Bekerja di berbagai timeframe, cocok untuk trader jangka pendek maupun swing trader.
Namun demikian, indikator Aroon tidak sempurna:
- Dapat menghasilkan data palsu pada kondisi sideways atau pasar yang berombak.
- Dapat sedikit tertinggal setelah pembalikan tajam atau lonjakan harga besar.
Indikator ini bekerja paling baik jika digunakan bersama alat konfirmasi lain, seperti:
- Moving Averages: membantu mengonfirmasi arah tren utama.
- ADX (Average Directional Index): mengukur kekuatan tren untuk menyaring sinyal lemah.
- RSI (Relative Strength Index): mengidentifikasi kondisi overbought atau oversold, menambah perspektif momentum.
Menggabungkan alat-alat ini dapat membantu memastikan apakah Aroon mencerminkan kekuatan pasar yang nyata atau hanya noise sementara.
Indikator Aroon memberikan cara yang jelas untuk melihat seberapa kuat sebuah tren — bukan hanya ke mana arah pergerakannya, tetapi juga seberapa besar energinya masih tersisa. Dengan melacak waktu dari high dan low, Aroon membantu mengidentifikasi kapan momentum terbentuk, melemah, atau berpotensi berbalik arah.
Tambahkan ke dalam perangkat analisis Anda sebagai alat pengecekan kesehatan tren. Jika digunakan bersama indikator lain, Aroon dapat membantu Anda masuk lebih awal, keluar lebih tepat, dan trading dengan lebih percaya diri mengikuti ritme pasar.